


How can we help?
New - FOGO (Food Organics and Garden Organics)
Parramatta Town Hall
Parramatta Aquatic Centre
PHIVE - 5 Parramatta Square
Riverside Theatres
Book a Clean-Up
Submit a Request
Library
Rates and Fees
Emergency Alert Dashboard
DA Tracker
Waste Collection Schedule
Car Parks
Book a Venue
Work at Council
AT Parramatta
Participate Parramatta

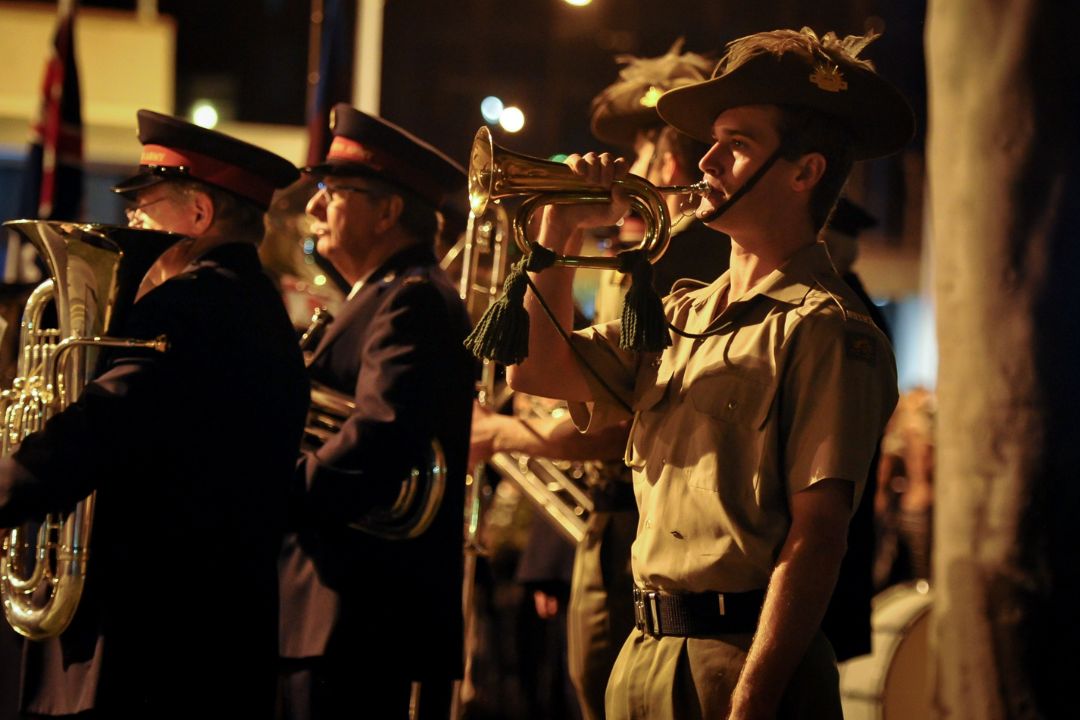
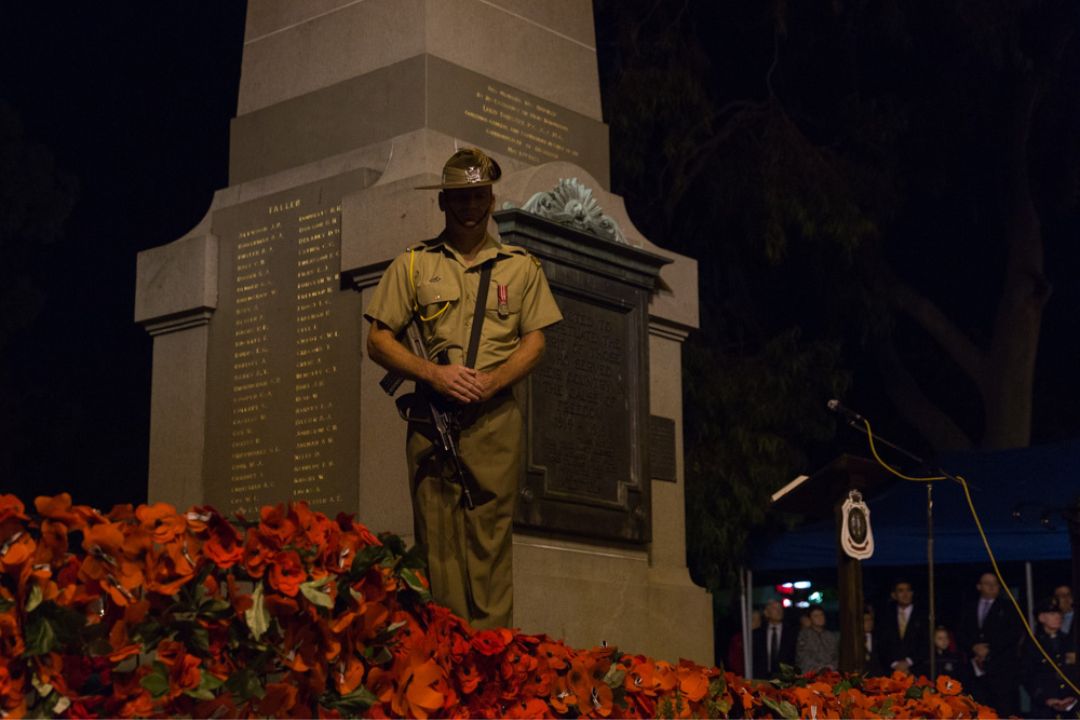
Parramatta Remembers
Our local Epping and Parramatta RSL sub-Branches are hosting Services for the community to attend and commemorate ANZAC Day.

Hunts Creek Bridge
A new $11.5M single-span concrete bridge and associated roadworks will be constructed at Hunts Creek on North Rocks Road, North Parramatta.

Active Transport Corridors
Council knows that becoming greener and more sustainable is a priority for our community. That is why we're planning a range of pedestrian and cyclist routes to help you get around off-road. Visit Participate Parramatta and have your say on our active transport projects open for community feedback.